A year of ChatGPT is a fifth of a beer
I built an interactive that prices drinks in AI queries — and lets you flip the accounting scope and the workload unit that make published AI water numbers differ by 100x.
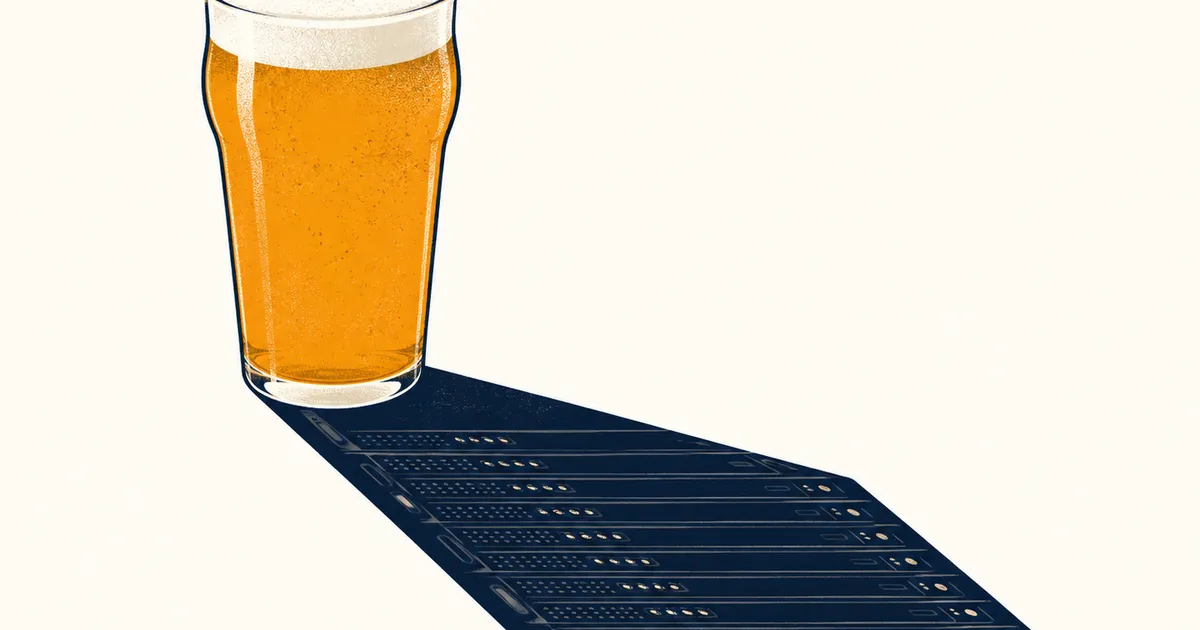
Asking ChatGPT 30 questions a day for a year uses about a fifth of the water behind one beer. That counts both data-center cooling and the power plants generating the electricity — the closest AI analog to how the beer number counts the water behind the barley.
I built an interactive that prices drinks this way: pick a beer, a coffee, a glass of milk, and see its water footprint in ChatGPT queries. One beer ≈ 53,300 queries. One coffee ≈ 66,200. A glass of tap water ≈ 178.
A year of 30 daily queries is 21.9 liters at the 2 mL scope; one beer is 106.5. The drinks give a scale; the reader picks the scope.
Why every AI water number differs from every other one
Published water-per-query figures span more than 100x: Google measured 0.26 mL per median Gemini prompt, Sam Altman cited 0.000085 gallons (0.32 mL) for the average ChatGPT query, a benchmarking preprint models a short GPT-4o query near 2 mL, and Mistral’s life-cycle assessment reports 45 mL per 400-token response.
These numbers barely disagree about physics. They disagree about where to draw the boundary:
- 0.26–0.32 mL: Google defines its figure as on-site data-center cooling water only; OpenAI states no boundary, and I treat it the same because it is within 25% of Google’s.
- ~2 mL adds the water evaporated at the power plants generating the query’s electricity.
- 45 mL is a life-cycle assessment — upstream electricity, cooling, and embodied hardware, no training — of one 400-token Le Chat response, a response about as short as the 2 mL query; the gap is boundary and data-center location, not length.
The calculator defaults to the middle scope because it is the closest match to how the drink side is measured. Beer’s footprint — 298 liters per kilogram, from the standard crop-water tables — counts the water behind the barley, not just the brewery’s taps. The consistent AI analog counts the water behind the electricity, not just the cooling loop. Counting only cooling is like measuring beer by what the brewery pours in.
You can flip the scope yourself. The comparison survives every setting: even at Mistral’s 45 mL, one beer still equals more than 2,000 responses.
Agents change the unit
The published per-query figures describe one short text prompt. Reasoning models emit several times the tokens of a chat response, and agents chain many calls per task — Anthropic measured its multi-agent systems at about 15x the tokens of a chat interaction. Since water scales with tokens, the calculator lets you count in reasoning responses (10x — I asked Claude for a mid-range estimate of the 2.5–50x published spread) or agentic tasks (15x).
One beer = 3,550 agentic tasks at the default scope: 10 a day for a year. At Mistral’s 45 mL it is about 160.
The aggregate is the same picture
A Patterns paper models all AI systems worldwide at 312.5–764.6 billion liters of water in 2025. The US drink categories I could source from government and industry data:
| Category | Year | Water footprint (liters) | vs global AI |
|---|---|---|---|
| Coffee | 2024/25 | 24.9 trillion | 33–80x |
| Milk | 2025 | 19.8 trillion | 26–63x |
| Soda | 2025 | 15.3 trillion | 20–49x |
| Beer | 2023 | 7 trillion | 9.2–22x |
| Plant-based milk | 2025 | 0.4 trillion | 0.5–1.3x |
| All nine tracked | — | 74.4 trillion | 97–238x |
US coffee’s footprint is 33–80x global AI’s. Extrapolating AI to 2026 (I asked Claude to estimate growth: 1.5x, within the published 1.3–2.45x) puts the nine categories at 65–159x the projected range.
What this doesn’t say
Water footprints measure volume, not scarcity. A liter evaporated from a stressed aquifer in Arizona is not a liter of rain on Bavarian barley, and the comparison doesn’t pretend otherwise.
The local version of the question — one campus drawing from one watershed, peaking in summer — is a siting and water-rights question this page does not address.
Provenance
Every figure on the page links to its source — the Mekonnen & Hoekstra crop and animal water tables, USDA and NIAAA volume data, and the per-query figures above. The three Claude-estimated numbers (the 2026 projection, the 10x reasoning multiplier, and the footprint blend for plant-based milk) are flagged as estimates on the page. The constants and derivations live in a tested module — a vitest suite pins the headline numbers, so if a source changes, the page fails loudly instead of drifting quietly. If you find a better source for any figure, tell me and I’ll swap it in.
Andy Masley’s post prompted the question.
Drink responsibly. Prompt freely: maxghenis.com/drinking-ai